Across Porirua, the subsurface rarely tells a straightforward story. You’ll encounter greywacke basement that can rise sharply within a few tens of metres, buried stream channels filled with variable alluvium, and weathered zones that drillers sometimes mistake for solid rock. Seismic tomography — both refraction and reflection — gives us a continuous velocity cross-section through these transitions, revealing where competent rock actually begins and where low-velocity pockets might concentrate strain during a shake. The Porirua basin, shaped by the Ohariu Fault and flanked by Tertiary sediments, demands more than a sparse borehole grid to characterise site conditions reliably. When we combine P-wave and S-wave refraction profiles with targeted reflection lines, the resulting tomogram highlights velocity contrasts that correlate directly with stiffness, rippability, and seismic site class under NZS 1170.5. For sites where foundation design hinges on depth-to-bedrock, we often pair the seismic campaign with targeted SPT drilling to calibrate velocity values against measured N-values, anchoring the geophysical interpretation in direct ground-truth data.
Seismic velocity is not an abstract parameter — it’s the single most continuous measurement we have of subsurface stiffness between boreholes, and in Porirua’s variable greywacke terrain it often catches transitions that drilling alone misses.
Methodology and scope
Local considerations
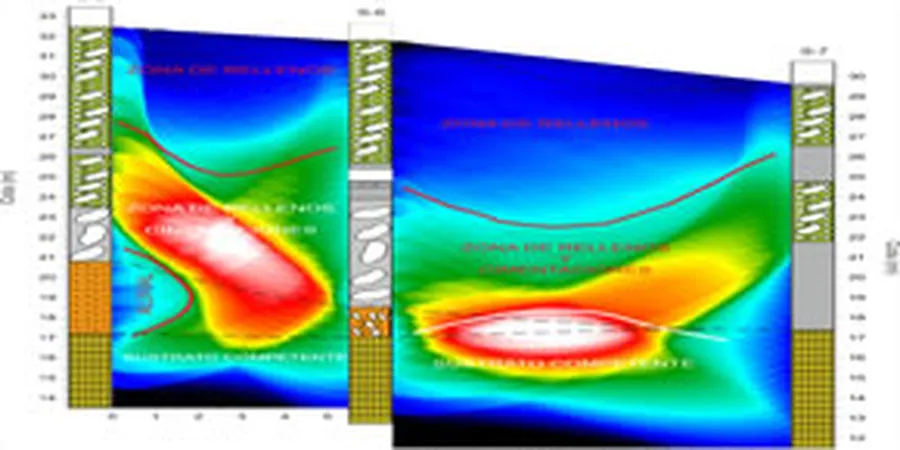
A five-storey mixed-use building proposed near the Porirua city centre sat directly over a buried paleochannel that two widely spaced boreholes had missed entirely. The preliminary geotechnical model assumed uniform alluvial gravels over greywacke at 18 m depth. When the seismic refraction survey was shot along three parallel lines, the tomogram showed a distinct low-velocity trough — P-wave velocities dropping below 700 m/s — cutting diagonally across the site at 10 to 14 m depth. That trough represented soft, compressible silts and organic clays filling an ancient stream bed, invisible to the borehole grid. Without that seismic image, the structural engineer would have designed piles to a “bedrock” that wasn’t actually continuous, risking differential settlement under seismic loading. The tomographic data allowed the team to map the channel boundaries, relocate pile caps to competent ground, and avoid a costly post-excavation redesign. In Porirua’s post-glacial landscape, buried channels, fault-parallel shear zones, and irregular weathering fronts are the norm, not the exception, and seismic tomography is the tool that reveals them before excavation begins.
Applicable standards
NZS 1170.5:2004 (Structural design actions — Earthquake actions), ASTM D5777-18 (Standard Guide for Using the Seismic Refraction Method), ASTM D7128-18 (Standard Guide for Using the Seismic Reflection Method), IAEG / NZGS guidelines for seismic site classification
Associated technical services
P-Wave Refraction Tomography
Designed for mapping depth to bedrock, rippability assessment, and identifying low-velocity zones associated with fault gouge or deeply weathered greywacke. We deploy 24- or 48-channel arrays with spreads up to 120 m, using first-break travel-time tomography to resolve velocity gradients laterally and vertically.
S-Wave (MASW/ReMi) and Combined P- and S-Wave Surveys
For seismic site classification per NZS 1170.5, we acquire S-wave velocity profiles using active-source MASW or passive ReMi arrays. Combined P- and S-wave tomography yields Poisson’s ratio distributions, which are particularly sensitive to saturation and weathering state in Porirua’s mixed soils.
High-Resolution Seismic Reflection
When investigation depth exceeds 30–40 m — for deep basin mapping, fault imaging, or tunnel alignment studies — reflection profiling with CMP stacking provides continuous stratigraphic detail far beyond the reach of refraction methods or boreholes alone.
Typical parameters
Frequently asked questions
How does seismic tomography differ from a standard seismic refraction survey, and which do I need for a Porirua site?
Standard refraction interprets the subsurface as a set of discrete, flat-lying layers with constant velocities, which rarely matches Porirua’s irregular greywacke surface. Seismic tomography uses iterative inversion algorithms to produce a continuous 2D velocity cross-section, capturing lateral velocity gradients, dipping interfaces, and localised low-velocity anomalies such as shear zones or buried channels. For most Porirua sites where ground conditions change laterally over short distances, tomographic processing is the appropriate choice.
Can seismic methods detect the Ohariu Fault or other faults on my property?
Yes, high-resolution seismic reflection and tomographic refraction surveys can image fault strands by identifying abrupt lateral velocity contrasts, offset reflectors, or zones of reduced seismic velocity associated with fault gouge. However, the resolution depends on the fault throw relative to the survey geometry, and confirmation through trenching or closely spaced boreholes is often required for a definitive fault avoidance assessment.
What is the typical cost range for a seismic tomography survey in the Porirua area?
For a site investigation covering two to four seismic lines with standard processing, costs in Porirua generally fall between NZ$4,990 and NZ$8,770 depending on the number of spreads, source type, and whether P-wave only or combined P- and S-wave acquisition is required. A site-specific quote is prepared after reviewing the investigation objectives and site access conditions.
How do you calibrate seismic velocities to actual ground conditions for foundation design?
The reference range for this service in Porirua is NZ$4.990 - NZ$8.770. The final price depends on the project scope and volume.